Broadway Data Boogie Woogie
Noah Garcia and I participated in the Data Through Design 2021 exhibition. The theme of the exhibition was "Ground Truth." Each participating artist used a publicly-available dataset from the NYC Open Data portal as the basis for an artwork that looked beyond the data and illuminated something about the reality on the ground.
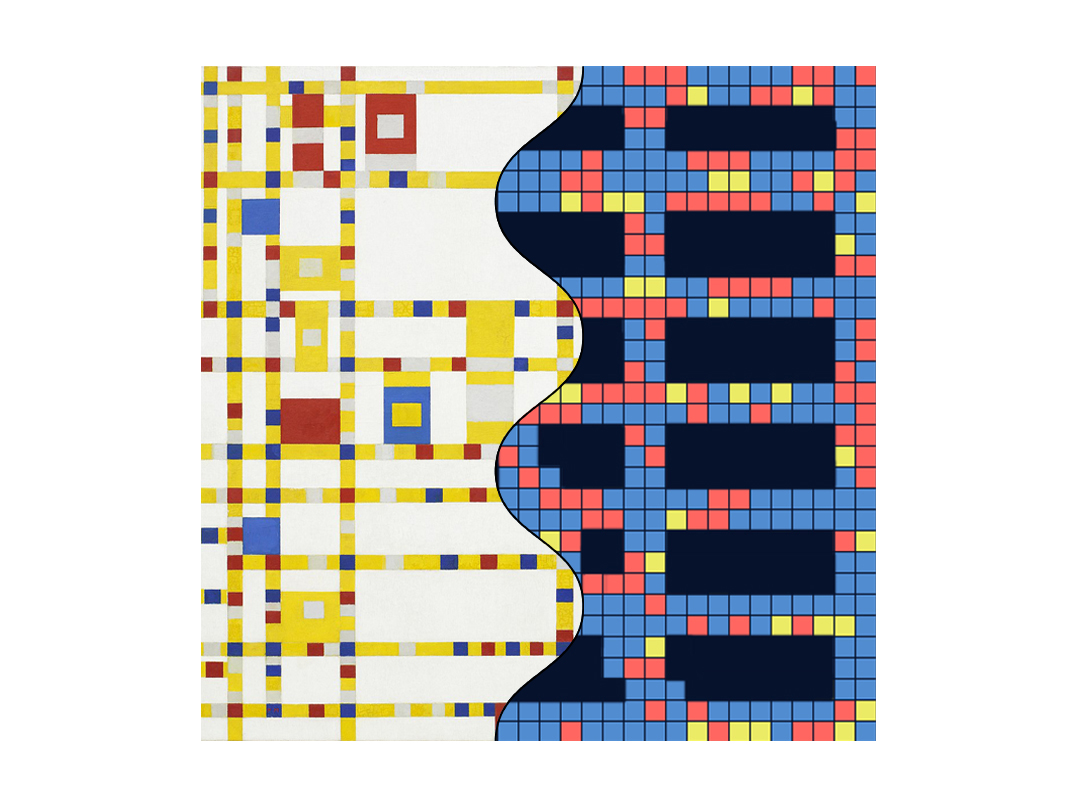
We reimagined Piet Mondrian’s Broadway Boogie Woogie as a traffic data visualization, reinvigorating the century-old abstract art tradition for a 21st-century context.
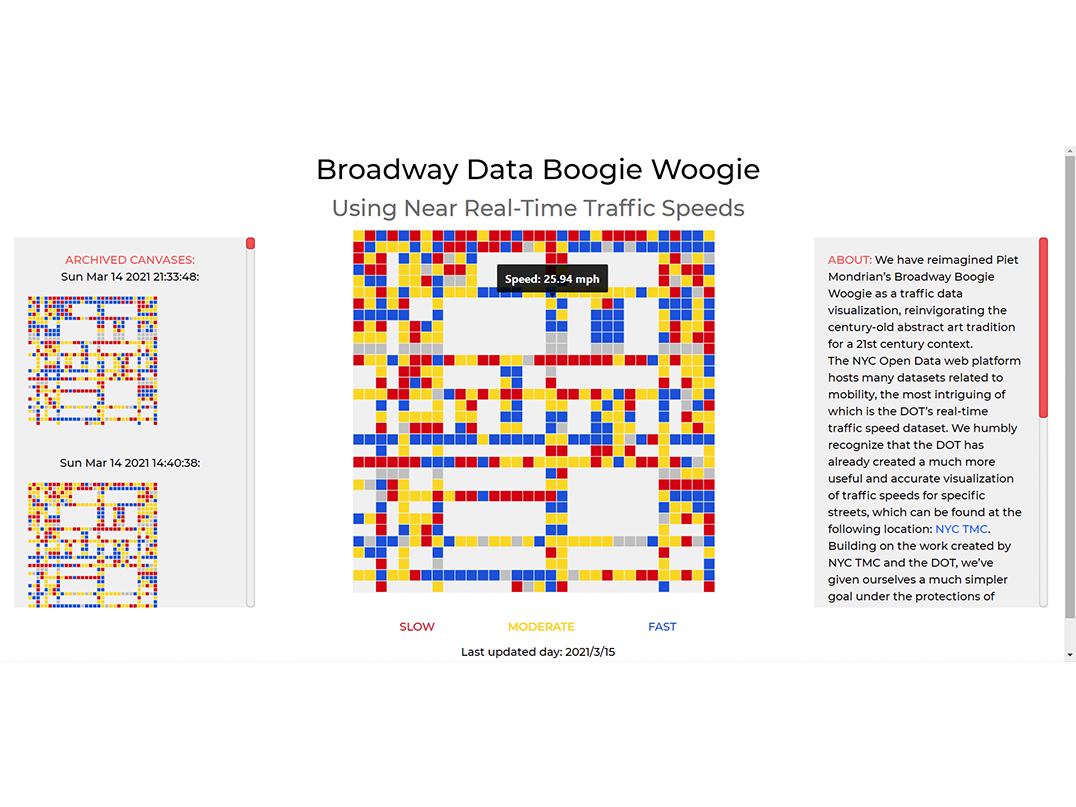
The NYC Open Data web platform hosts many datasets related to mobility, the most intriguing of which is the DOT’s real-time traffic speed dataset. We humbly recognize that the DOT has already created a much more useful visualization of traffic speeds which can be found at the following location: https://webcams.nyctmc.org/. We’ve given ourselves a much simpler goal under the protections of artistic expression to create a dynamic, two-dimensional update to Broadway Boogie Woogie: by taking a map of Manhattan, subdividing it into a grid of squares, and painting each square according to the traffic speed that has been most recently measured. This dataset is updated every half hour, so the image will change in kind.
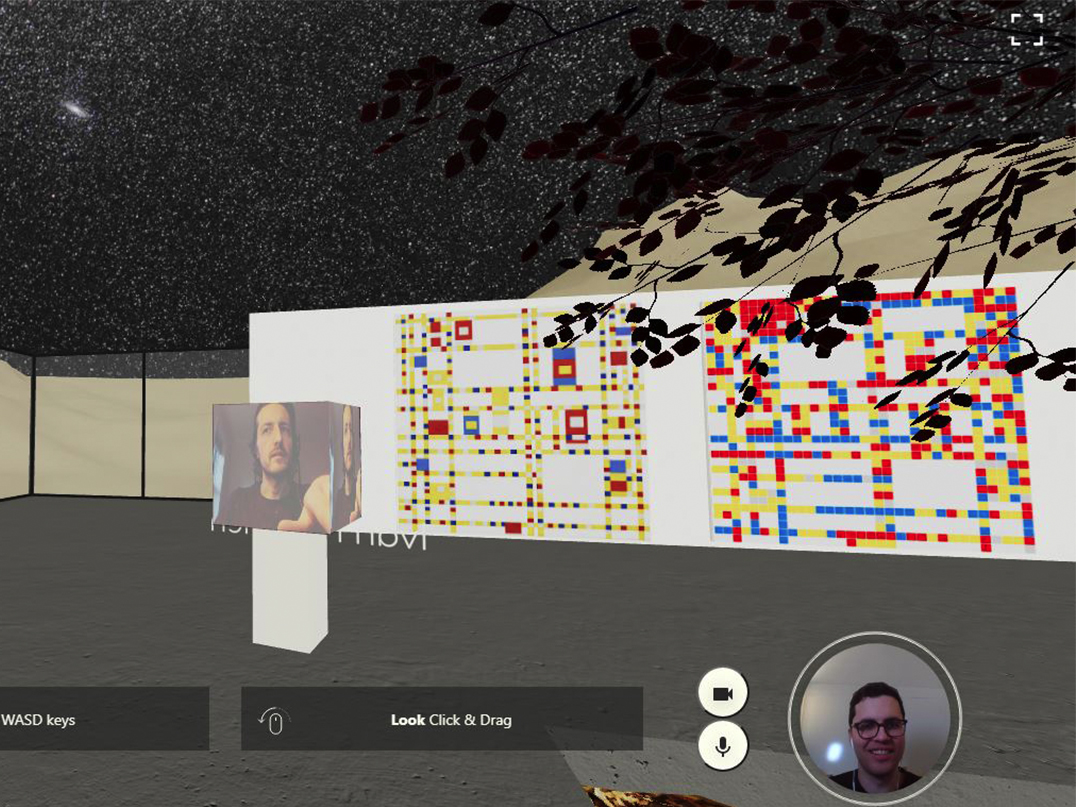
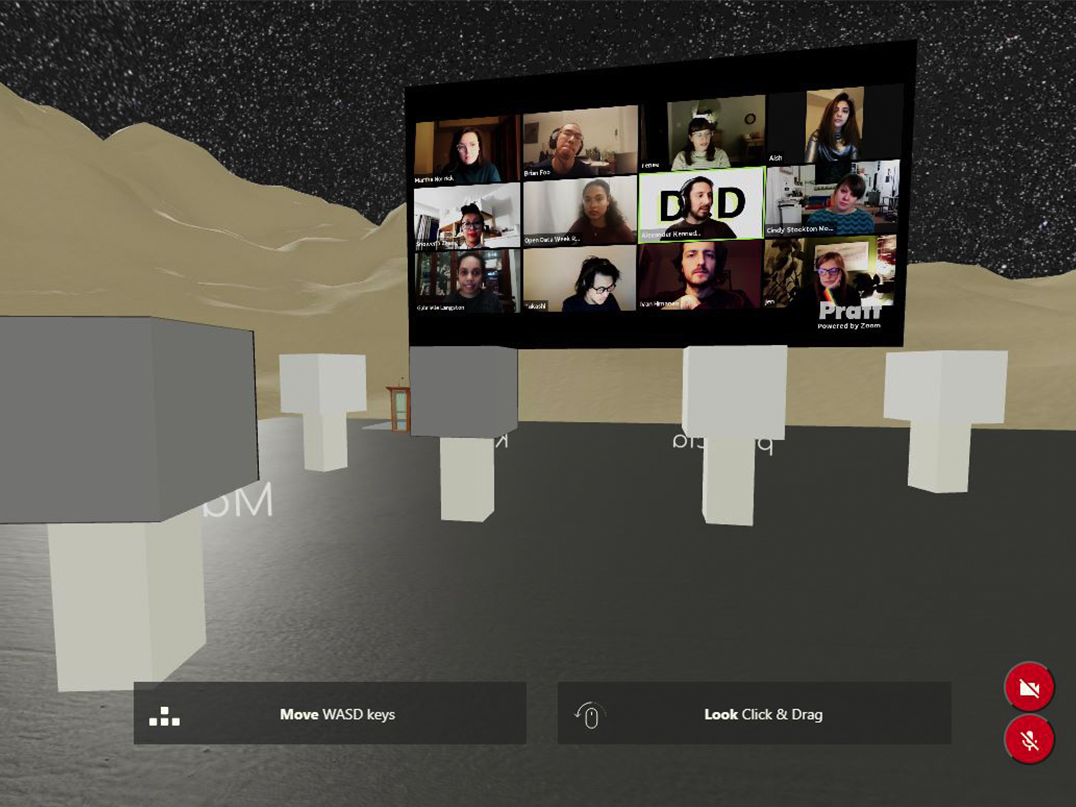
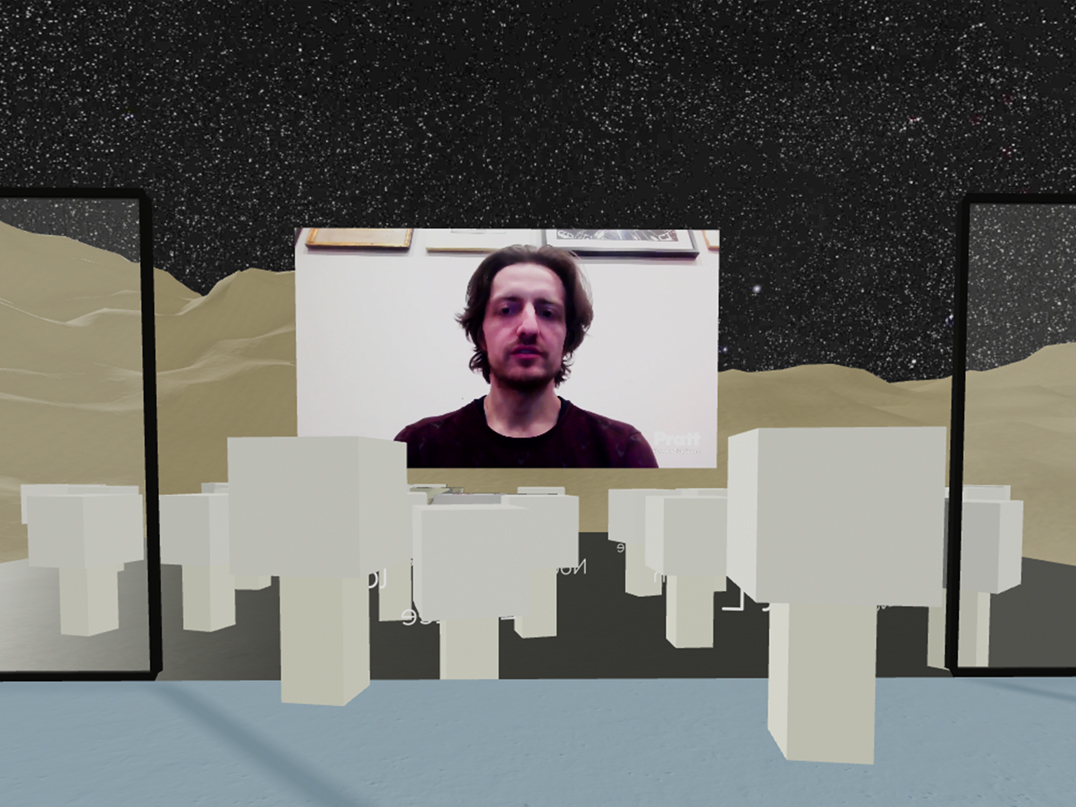
The exhibition opening was held virtually, on a platform called Arium, in which visitors walked through gallery spaces like avatars in a video game. With webcams on, they were able to speak and mingle as in real life. Static images of the artists' works were displayed on walls.
Lastly, as part of NYC's Open Data Week, I and other artists participated in a panel discussion on the "ground truth" topic, on the present moment, and on the broader role of art in the digital age.
Broadway Data Boogie Woogie website
Noah Garcia & Ivan Himanen
Data Through Design 2021: Ground Truth
Digital mosaic, website
March 2021