As a first step into the larger project that is Reverse Commute, it’s essential to first draw the map of the communities I’m drawing together. Who are the folks living on the edge of the transit system? Is the presence of a station in their neighborhood relevant or impactful? How might livelihoods improve if the station were treated less as an endpoint and more like a new center?
We start, as we almost always do, with the latest US Census. I isolated the termini (last stops) of the subway system, drew a 2,000-foot circle around each (as the crow flies, which roughly equates to a 10-minute walking radius), and approximated the “catchment population” served by that circle (by calculating how much the walking radius circle overlapped with each adjacent 2020 Census Tract).
Termini are highlighted in red circles.
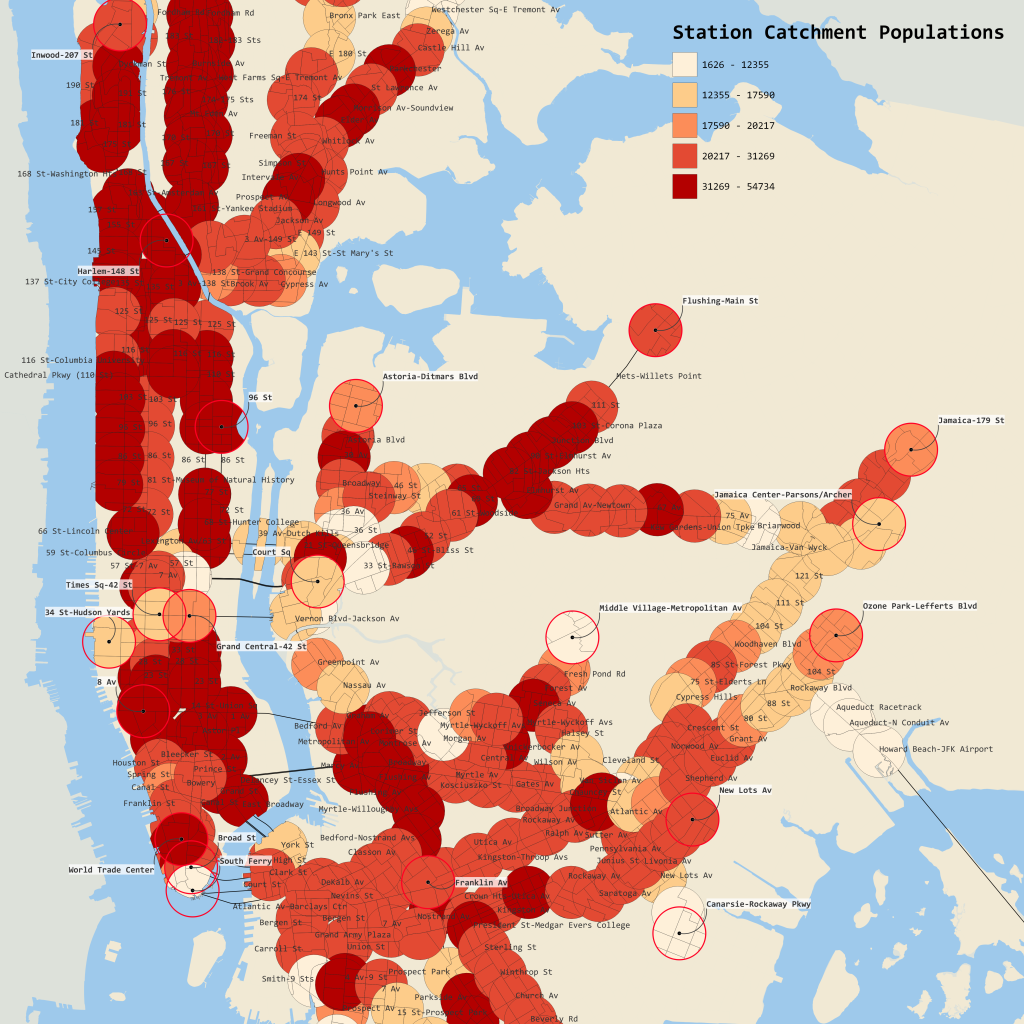
As we can expect, neighborhoods such as Midtown Manhattan, Jackson Heights, Williamsburg, and The South Bronx have very high population densities and therefore high catchment populations for each station.
Next, I used the publicly available MTA Subway Hourly Ridership dataset, which counts ridership per station, to calculate the percentage of population within this catchment area that uses the subway. The ridership numbers are taken from July 2022. How do these ridership numbers compare to those of more central stations?
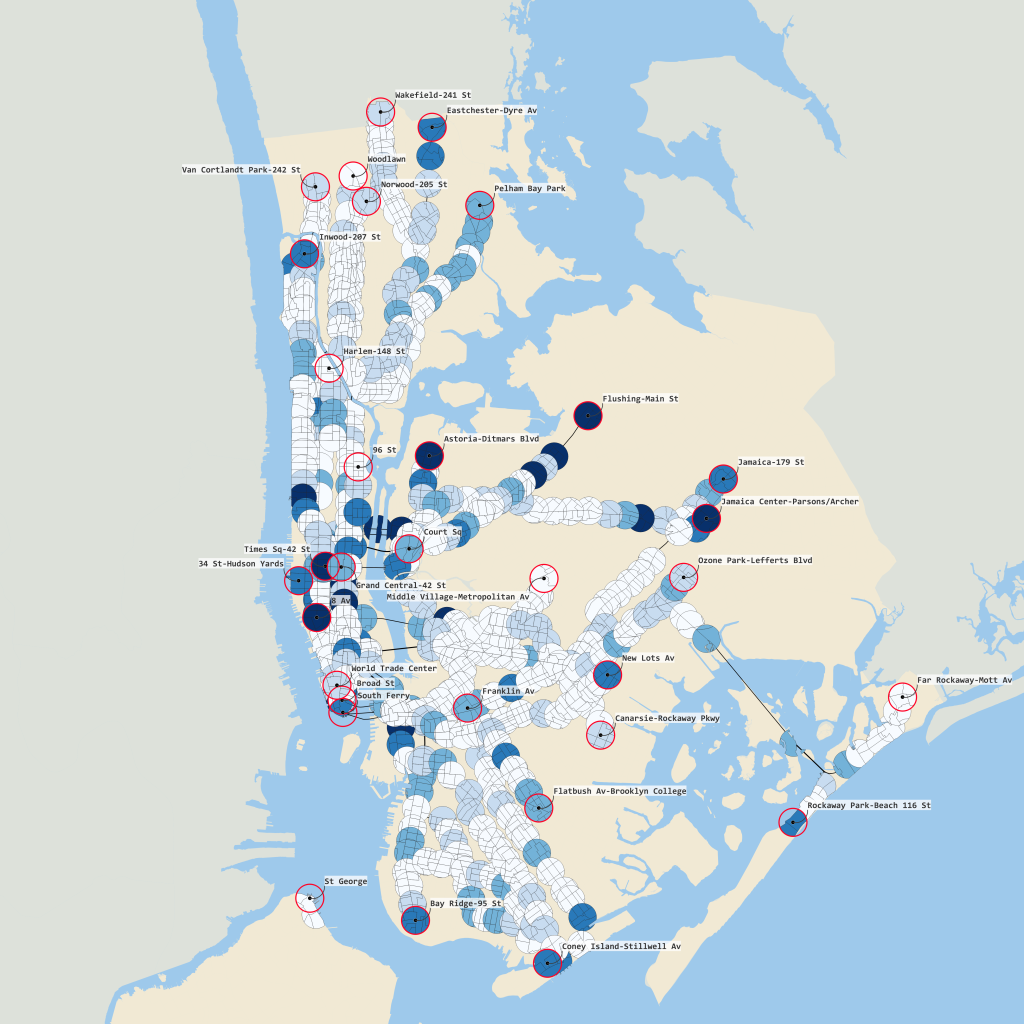
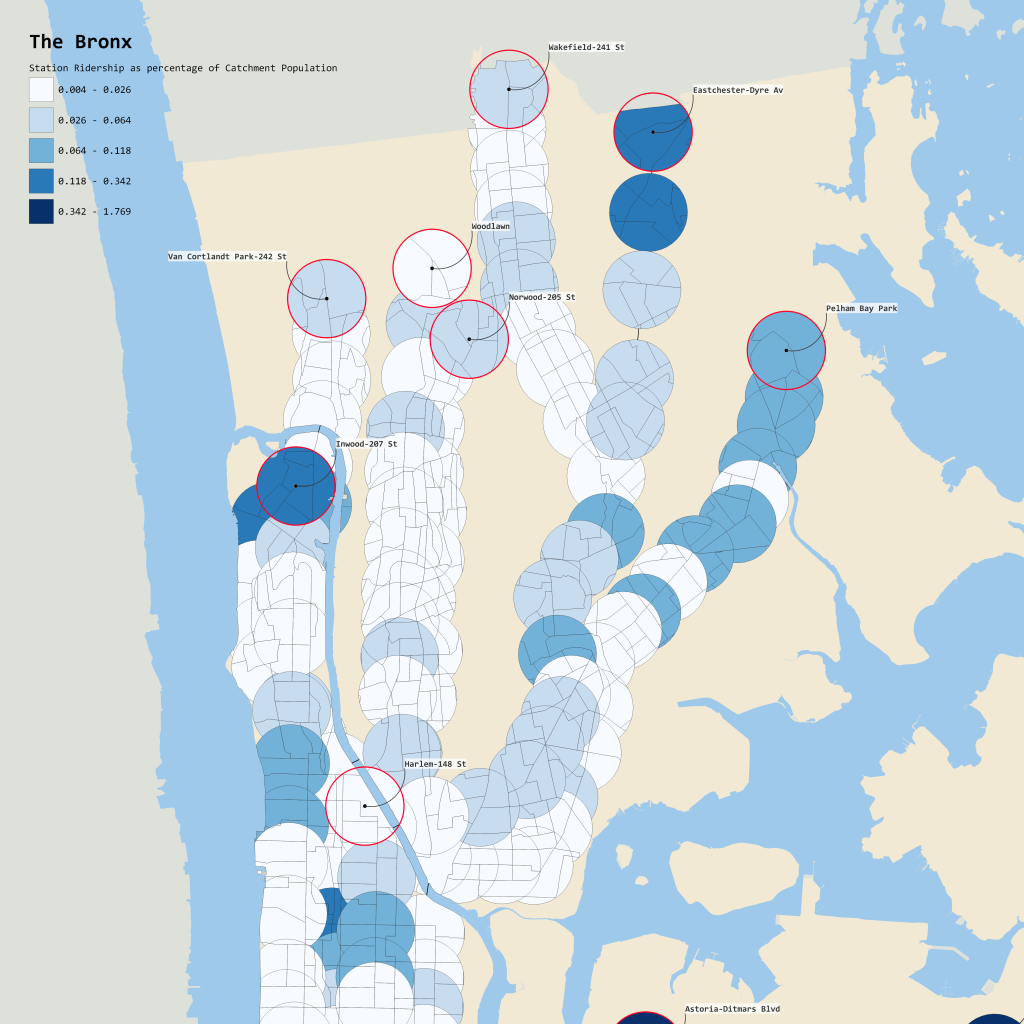
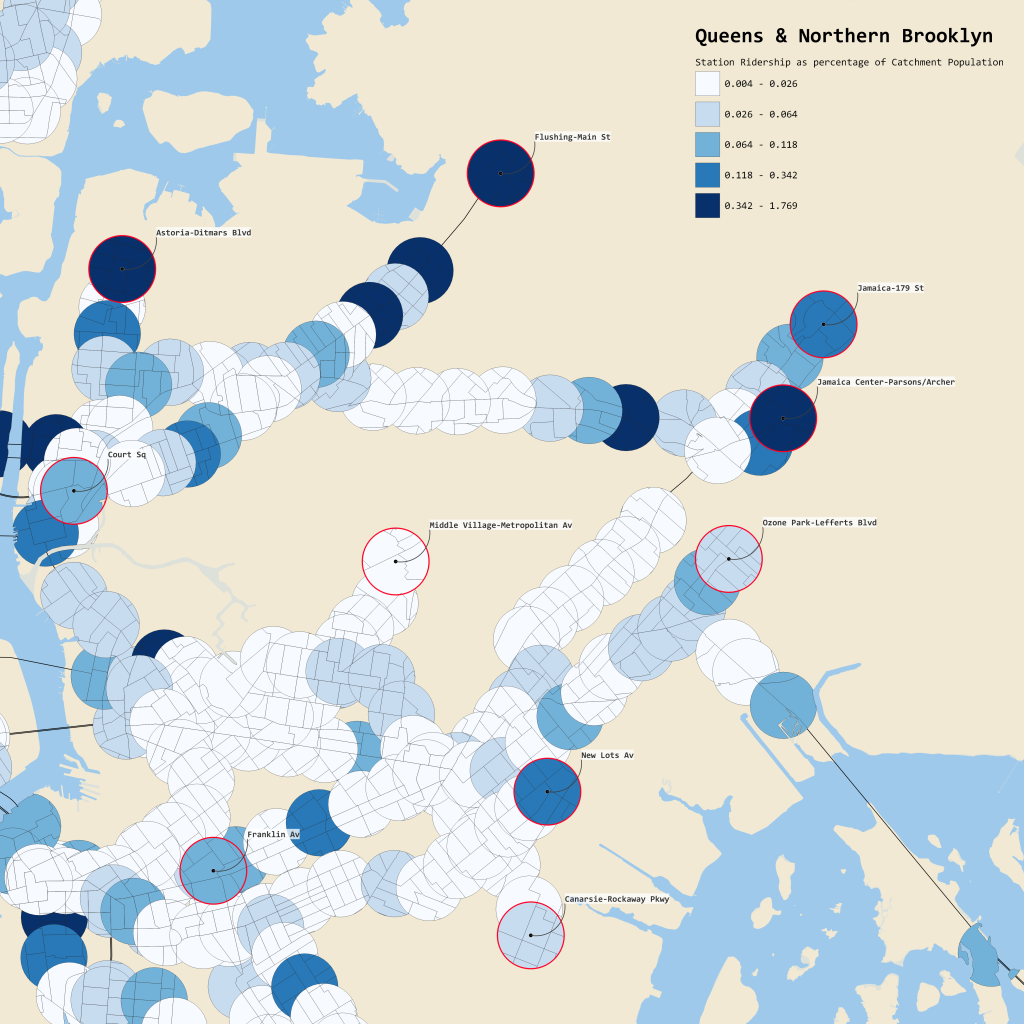
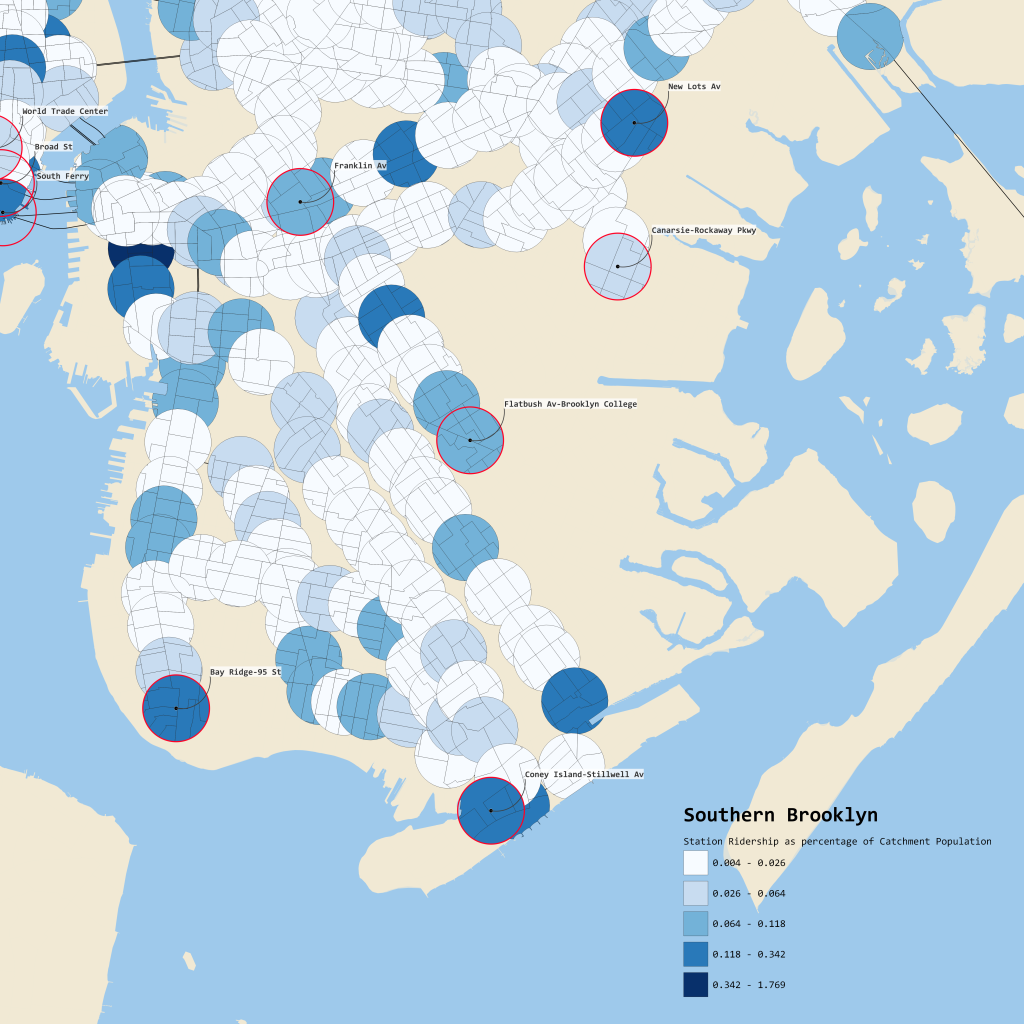
The result is almost the inverse of the stations’ catchment population. Noticing how the circles get darker near the end of subway lines, it is clear that more people rely on those stations than elsewhere. Interestingly, even those highest numbers are but a small percentage of the population that lives there– this low number may be impacted by external factors such as a particular time of day or day of the week. Considering that typical daily ridership across the entire subway system, according to the MTA, is in the single-digit millions, or about half of the NYC population, I’ll have to revisit, but the evidence is distinct enough to keep digging….